
Research · The News Front Data Desk
Lincolnshire tops Britain for tractor road collisions as dark evenings bring winter risk: across Britain, almost a third of winter collisions involving farm vehicles happen in the dark
Key findings
- Lincolnshire had 110 road collisions involving a tractor or other agricultural vehicle from 2021 to 2025, the most of any council area in Great Britain, and the highest rate at 19.6 per 1,000 miles of road, against 7.8 for Great Britain.
- Across Great Britain, 32.3% of collisions involving an agricultural vehicle from November to February happened in darkness, compared with 7.0% from May to August; in December the share was 45.5%.
- Collisions peak from June to September (45.0%), during the busiest months of the farming year, and 86.6% were on rural roads.
- Police recorded 1,917 road collisions involving at least one agricultural vehicle, such as a tractor, across Great Britain from 2021 to 2025.
- 88 of these collisions were fatal, and 94 people were killed; 674 collisions killed or seriously injured someone (as recorded by police). That fatal share, 4.6%, compares with 1.5% for all police-reported injury collisions.
Commissioned by Nick Young Tractor Parts
The findings in brief
- Lincolnshire had 110 road collisions involving a tractor or other agricultural vehicle from 2021 to 2025, the most of any council area in Great Britain, and the highest rate for its road length, 19.6 per 1,000 miles of road against 7.8 for Great Britain, The News Front Data Desk found.
- Across Great Britain, 32.3% of collisions involving an agricultural vehicle from November to February happened in darkness, compared with 7.0% from May to August, according to The News Front Data Desk’s analysis of Department for Transport road casualty data (STATS19) for 2021 to 2025.
- Collisions involving agricultural vehicles peak from June to September (45.0% of the total), during the busiest months of the farming year, The News Front Data Desk’s analysis found.
- Police recorded 1,917 of these collisions across Great Britain in the five years; 88 were fatal, a share of 4.6% compared with 1.5% for all police-reported injury collisions, the Department for Transport data shows.
- The data records which vehicles were involved, not who or what caused each collision, so it does not show fault.
As the clocks go back and evenings get darker, country roads change. From November to February, almost a third (32.3%) of police-reported injury collisions involving a tractor or other agricultural vehicle in Great Britain happened in darkness, against 7.0% from May to August. Over the five years from 2021 to 2025, Lincolnshire recorded more collisions involving farm vehicles than any other council area.
Across Great Britain, police recorded 1,917 road collisions involving an agricultural vehicle in those five years. In 88 of them someone died. In all, 94 people were killed and 671 were seriously injured, as recorded by police. The data records which vehicles were involved; it does not show who or what caused each collision.
The News Front Data Desk analysed the Department for Transport’s road casualty data (known as STATS19) for every injury collision on a public road in which at least one vehicle was recorded as an agricultural vehicle. Each collision is counted once, even when more than one farm vehicle was involved. To compare places of different sizes, we also measured collisions against the length of each council area’s road network, because there are no official figures for how far tractors travel in each area.
Which council area has the most collisions involving tractors and farm vehicles?
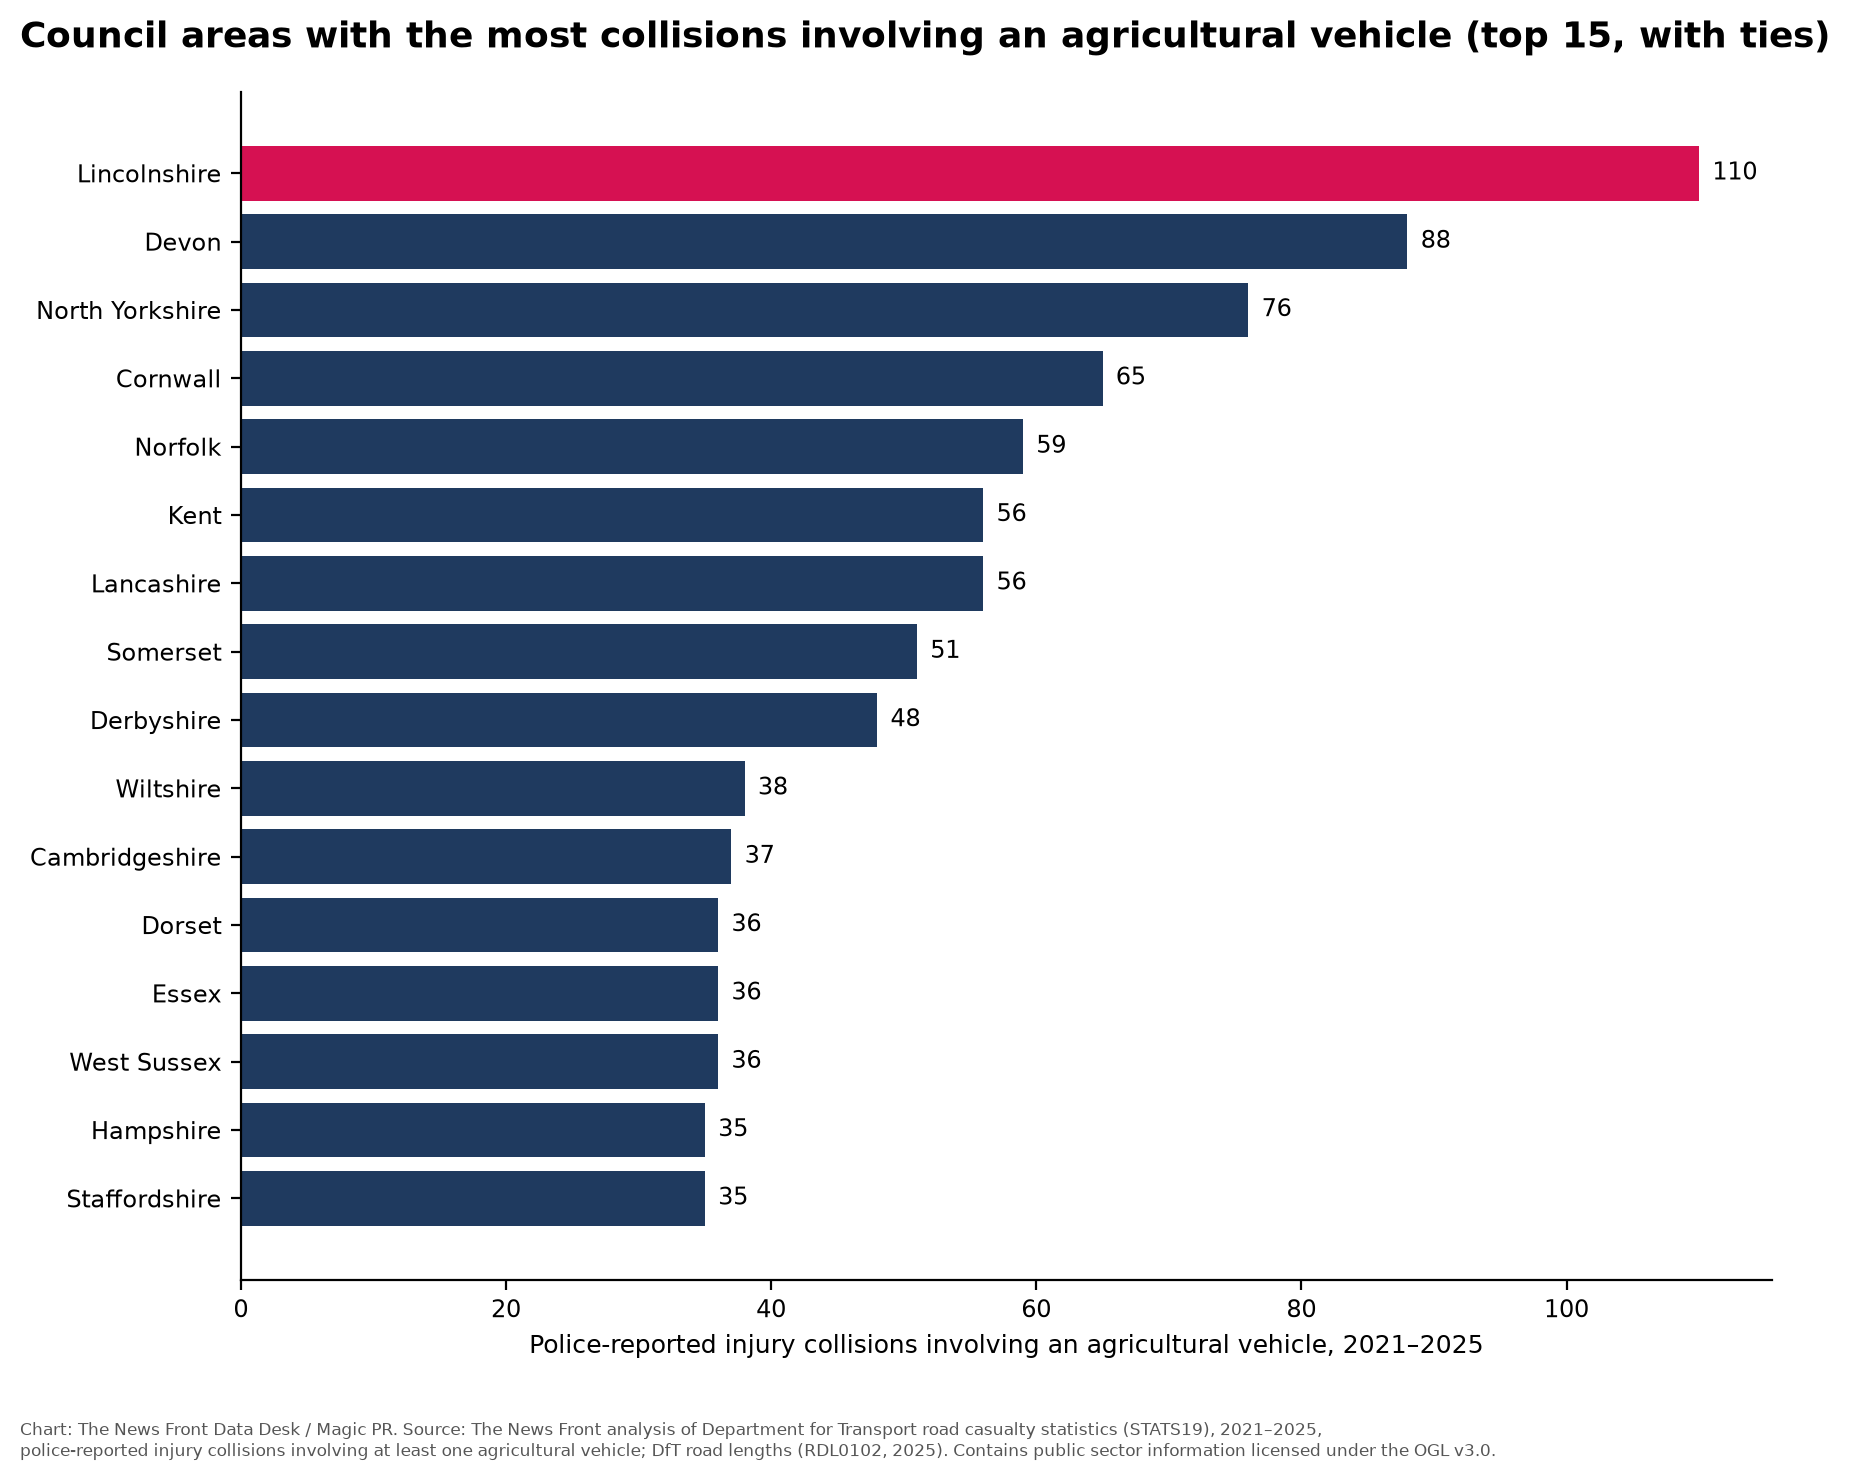
Lincolnshire has the most collisions involving an agricultural vehicle of any council area in Great Britain: 110 over the five years, 7 of them fatal. Devon is second with 88, followed by North Yorkshire (76), Cornwall (65) and Norfolk (59). Kent and Lancashire (56 each), Somerset (51), Derbyshire (48) and Wiltshire (38) complete the top ten.
Credit: Chart: The News Front Data Desk / Magic PR
What this chart shows: the council areas ranked in the top 15 for collisions involving an agricultural vehicle from 2021 to 2025 (16 areas, because two tie in 15th place); Lincolnshire is highlighted.
| Rank | Council area | Region or nation | Collisions | Fatal collisions | Collisions per 1,000 road miles | Rank by rate |
|---|---|---|---|---|---|---|
| 1 | Lincolnshire | East Midlands | 110 | 7 | 19.6 | 1 |
| 2 | Devon | South West | 88 | 4 | 10.8 | 26 |
| 3 | North Yorkshire | Yorkshire and The Humber | 76 | 4 | 13.9 | 6 |
| 4 | Cornwall | South West | 65 | 4 | 13.9 | 6 |
| 5 | Norfolk | East of England | 59 | 2 | 9.5 | 30 |
| 6 | Kent | South East | 56 | 1 | 9.5 | 30 |
| 6 | Lancashire | North West | 56 | 3 | 12.6 | 13 |
| 8 | Somerset | South West | 51 | 4 | 12.0 | 17 |
| 9 | Derbyshire | East Midlands | 48 | 0 | 13.5 | 9 |
| 10 | Wiltshire | South West | 38 | 1 | 13.0 | 12 |
| 11 | Cambridgeshire | East of England | 37 | 1 | 12.6 | 13 |
| 12 | Dorset | South West | 36 | 3 | 14.9 | 4 |
| 12 | Essex | East of England | 36 | 0 | 6.9 | 41 |
| 12 | West Sussex | South East | 36 | 1 | 13.8 | 8 |
| 15 | Hampshire | South East | 35 | 0 | 6.2 | 46 |
| 15 | Staffordshire | West Midlands | 35 | 3 | 8.9 | 32 |
| 17 | Dumfries and Galloway | Scotland | 34 | 1 | 11.7 | 20 |
| 17 | Shropshire | West Midlands | 34 | 3 | 10.5 | 28 |
| 19 | Suffolk | East of England | 33 | 3 | 7.8 | 37 |
| 20 | Cheshire East | North West | 31 | 0 | 18.0 | 3 |
| 20 | Nottinghamshire | East Midlands | 31 | 0 | 11.0 | 25 |
When do collisions involving tractors happen, and how does winter change the pattern?
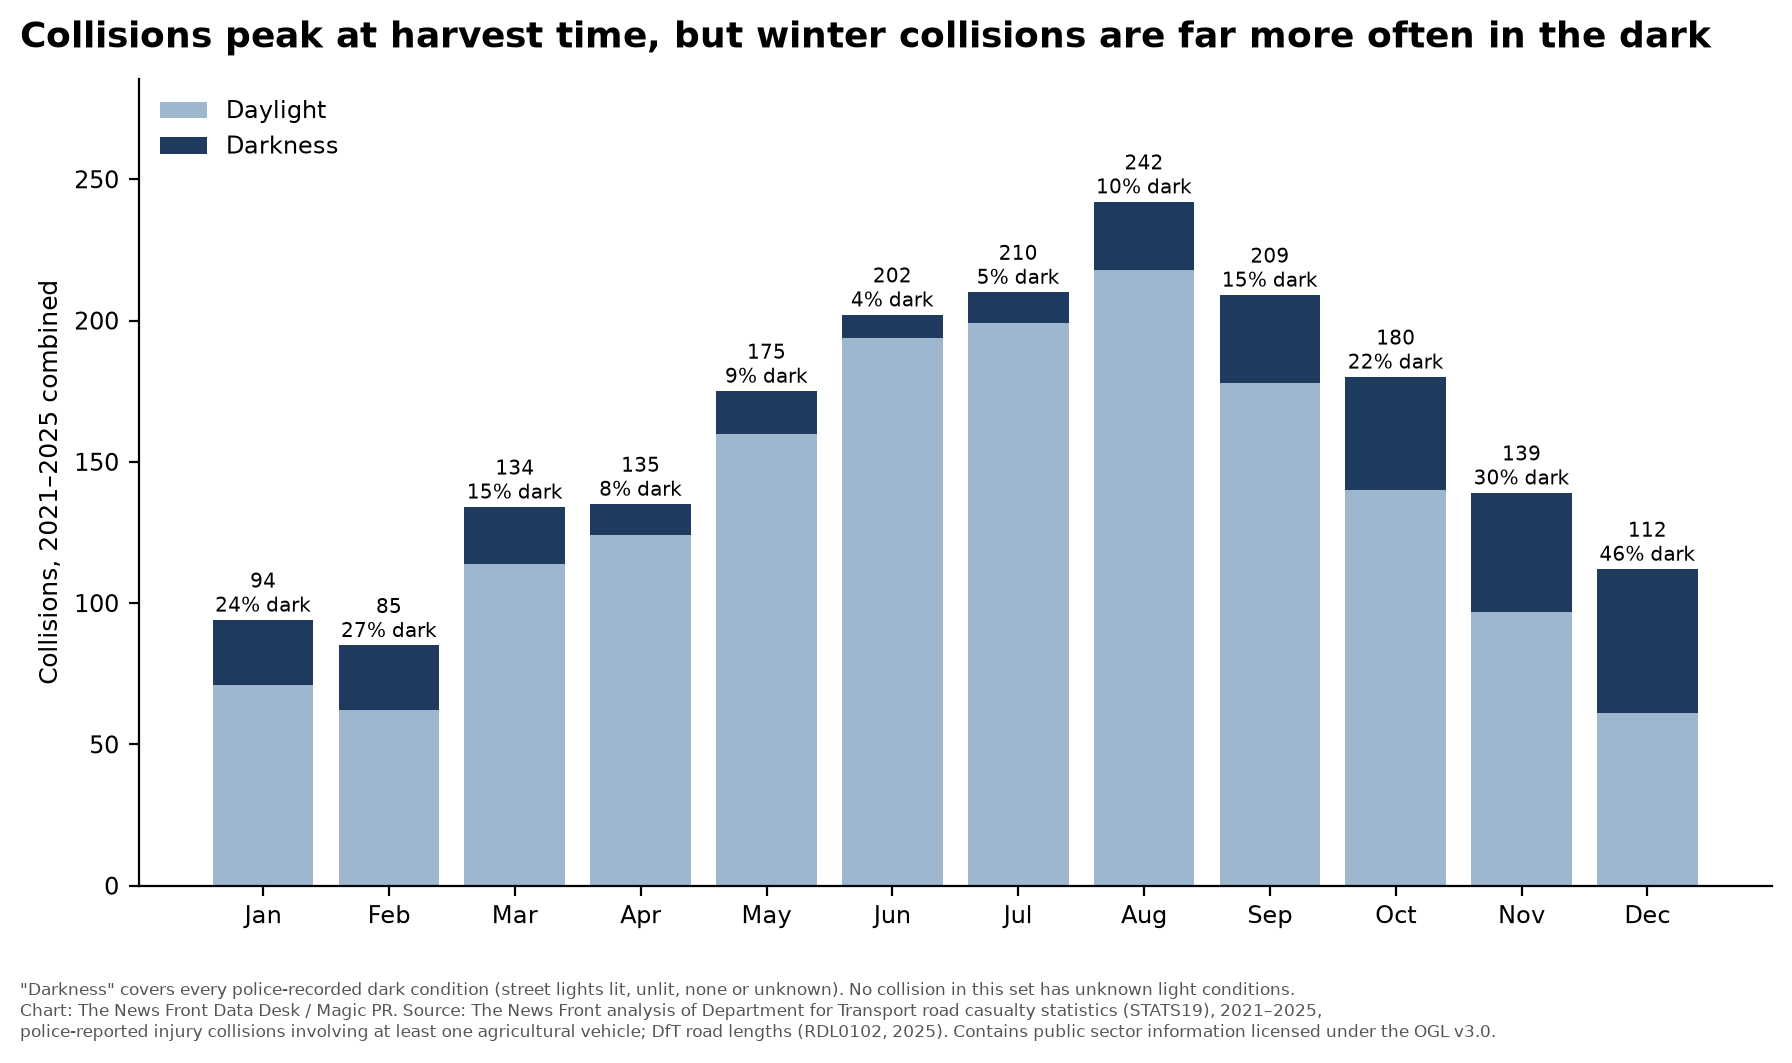
Collisions follow the farming year. They rise through the spring and peak from June to September, when 863 collisions (45.0%) took place. August is the busiest month, with 242. Winter brings fewer collisions but a different pattern: from November to February, 32.3% of collisions happened in darkness, compared with 7.0% from May to August. In December, almost half (45.5%) were in the dark.
Credit: Chart: The News Front Data Desk / Magic PR
What this chart shows: collisions by month for 2021 to 2025 combined, split into daylight and darkness.
Most collisions happened on country roads: 86.6% were on rural roads, 87.6% on single carriageways and 53.4% on roads with a 60mph limit.
Where is the collision rate highest for the length of road?
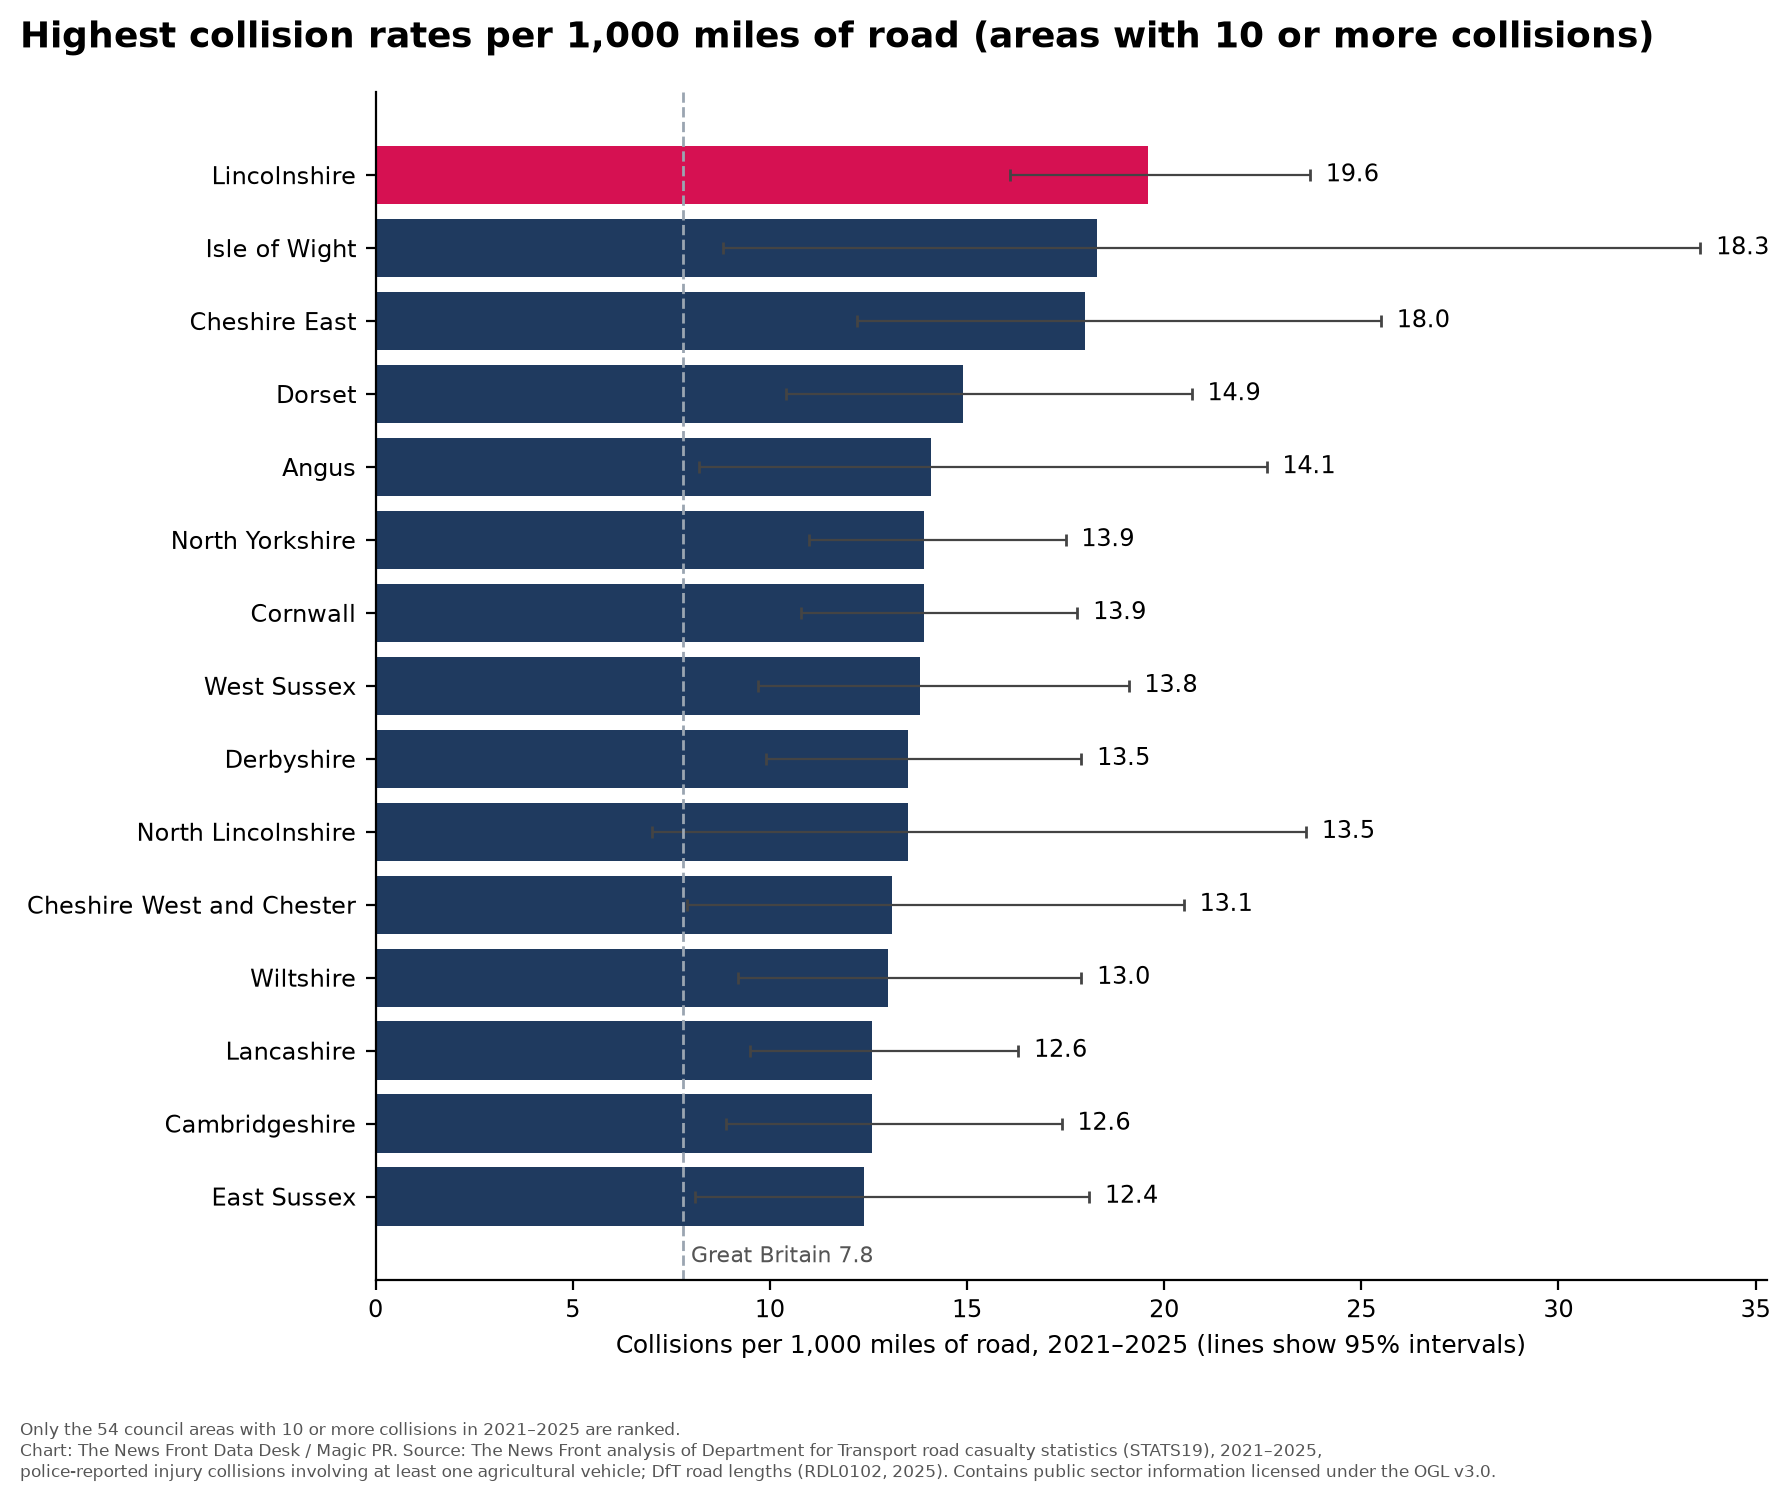
Large rural counties have long road networks, so we also measured collisions per 1,000 miles of road. The rate for Great Britain as a whole is 7.8. Among the 54 council areas with at least 10 collisions, Lincolnshire again has the highest rate, 19.6, two and a half times the national figure. The Isle of Wight (18.3) and Cheshire East (18.0) follow, then Dorset (14.9) and Angus (14.1), the highest in Scotland.
Several of these areas have small numbers of collisions, so the likely range around each rate is wide and the ranges overlap. Small differences between places should not be over-read.
Credit: Chart: The News Front Data Desk / Magic PR
What this chart shows: collisions per 1,000 miles of road for the 15 highest-rate council areas with at least 10 collisions, with 95% intervals and the Great Britain rate of 7.8.
The lowest rates among the ranked areas are in Highland (2.4 per 1,000 miles of road), Aberdeenshire (3.8), Hertfordshire and Oxfordshire (both 5.1) and Surrey (5.3). 36 council areas, most of them cities and large towns, recorded no collisions involving an agricultural vehicle at all.
How many collisions involving farm vehicles were there in Lincolnshire?
Lincolnshire’s 110 collisions are 5.7% of the Great Britain total, on 2.3% of its road length. 106 were on rural roads and 16 happened in darkness. 31 killed or seriously injured someone, as recorded by police. The yearly totals were 22 in 2021, 24 in 2022, 20 in 2023, 27 in 2024 and 17 in 2025.
By district, East Lindsey recorded the most collisions (33), followed by West Lindsey (26), Boston (15), South Kesteven (14), South Holland (13) and North Kesteven (9). Including North Lincolnshire (12) and North East Lincolnshire (4), there were 126 collisions across the historic county.
| Council area | Collisions | Fatal collisions | Collisions per 1,000 road miles | Rank by collisions (of 207) |
|---|---|---|---|---|
| Lincolnshire | 110 | 7 | 19.6 | 1 |
| North Lincolnshire | 12 | 0 | 13.5 | 44 |
| North East Lincolnshire | 4 | 0 | 9.8 | 81 |
Are collisions involving tractors more likely to be fatal?
4.6% of the collisions involving an agricultural vehicle were fatal, compared with 1.5% of all police-reported injury collisions in Great Britain over the same five years: about three times the share. Of the 2,473 people injured or killed, 1,320 were car occupants and 363 were travelling in agricultural vehicles. The data records which vehicles were involved; it does not show who or what caused each collision.
Are collisions involving tractors rising or falling?
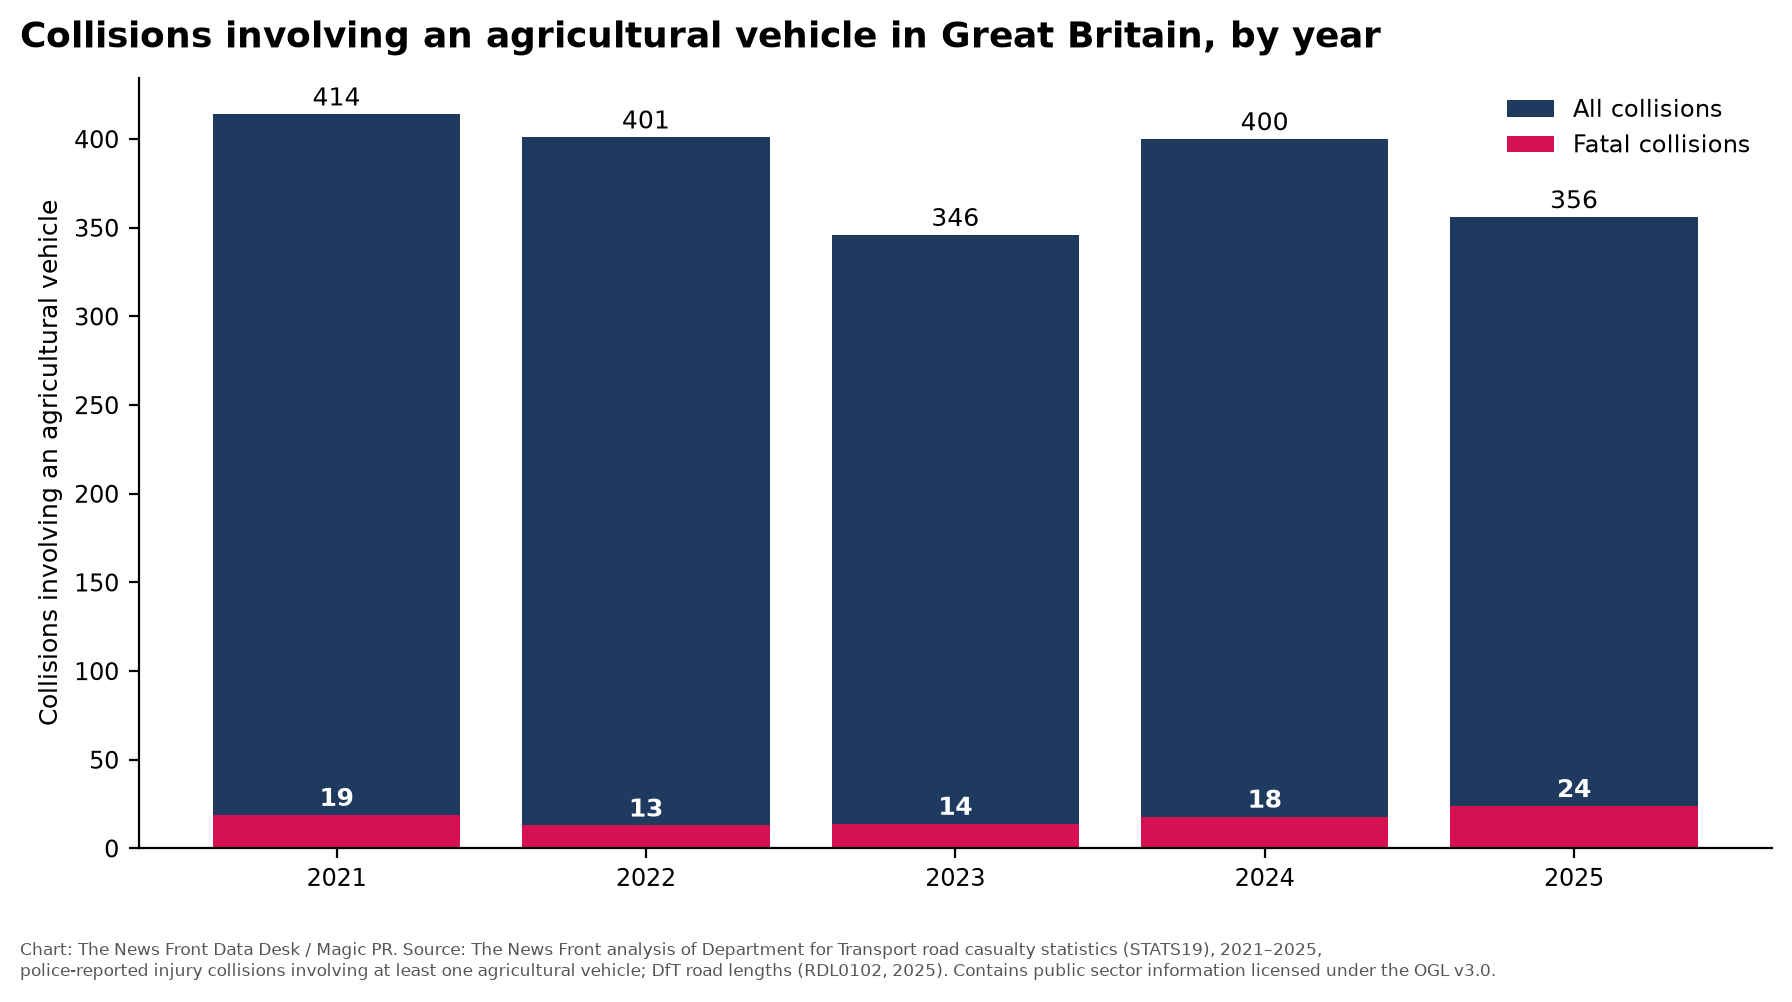
The number of collisions fell from 414 in 2021 to 356 in 2025, a fall of 14.0%. Fatal collisions did not follow the same pattern. There were 24 in 2025, the highest of the five years, and 26 people died. Annual numbers of fatal collisions are small and vary from year to year, between 13 and 24, so one year is not enough to show a trend.
Credit: Chart: The News Front Data Desk / Magic PR
What this chart shows: all collisions and fatal collisions involving an agricultural vehicle in each year from 2021 to 2025.
Which regions and nations have the highest rates?
The East Midlands has the highest regional rate, 12.1 collisions per 1,000 miles of road, followed by the South West (10.6), which has the most collisions of any region (330), and Yorkshire and The Humber (9.9). Rates are lower in Wales (5.9), Scotland (4.6) and London (3.5).
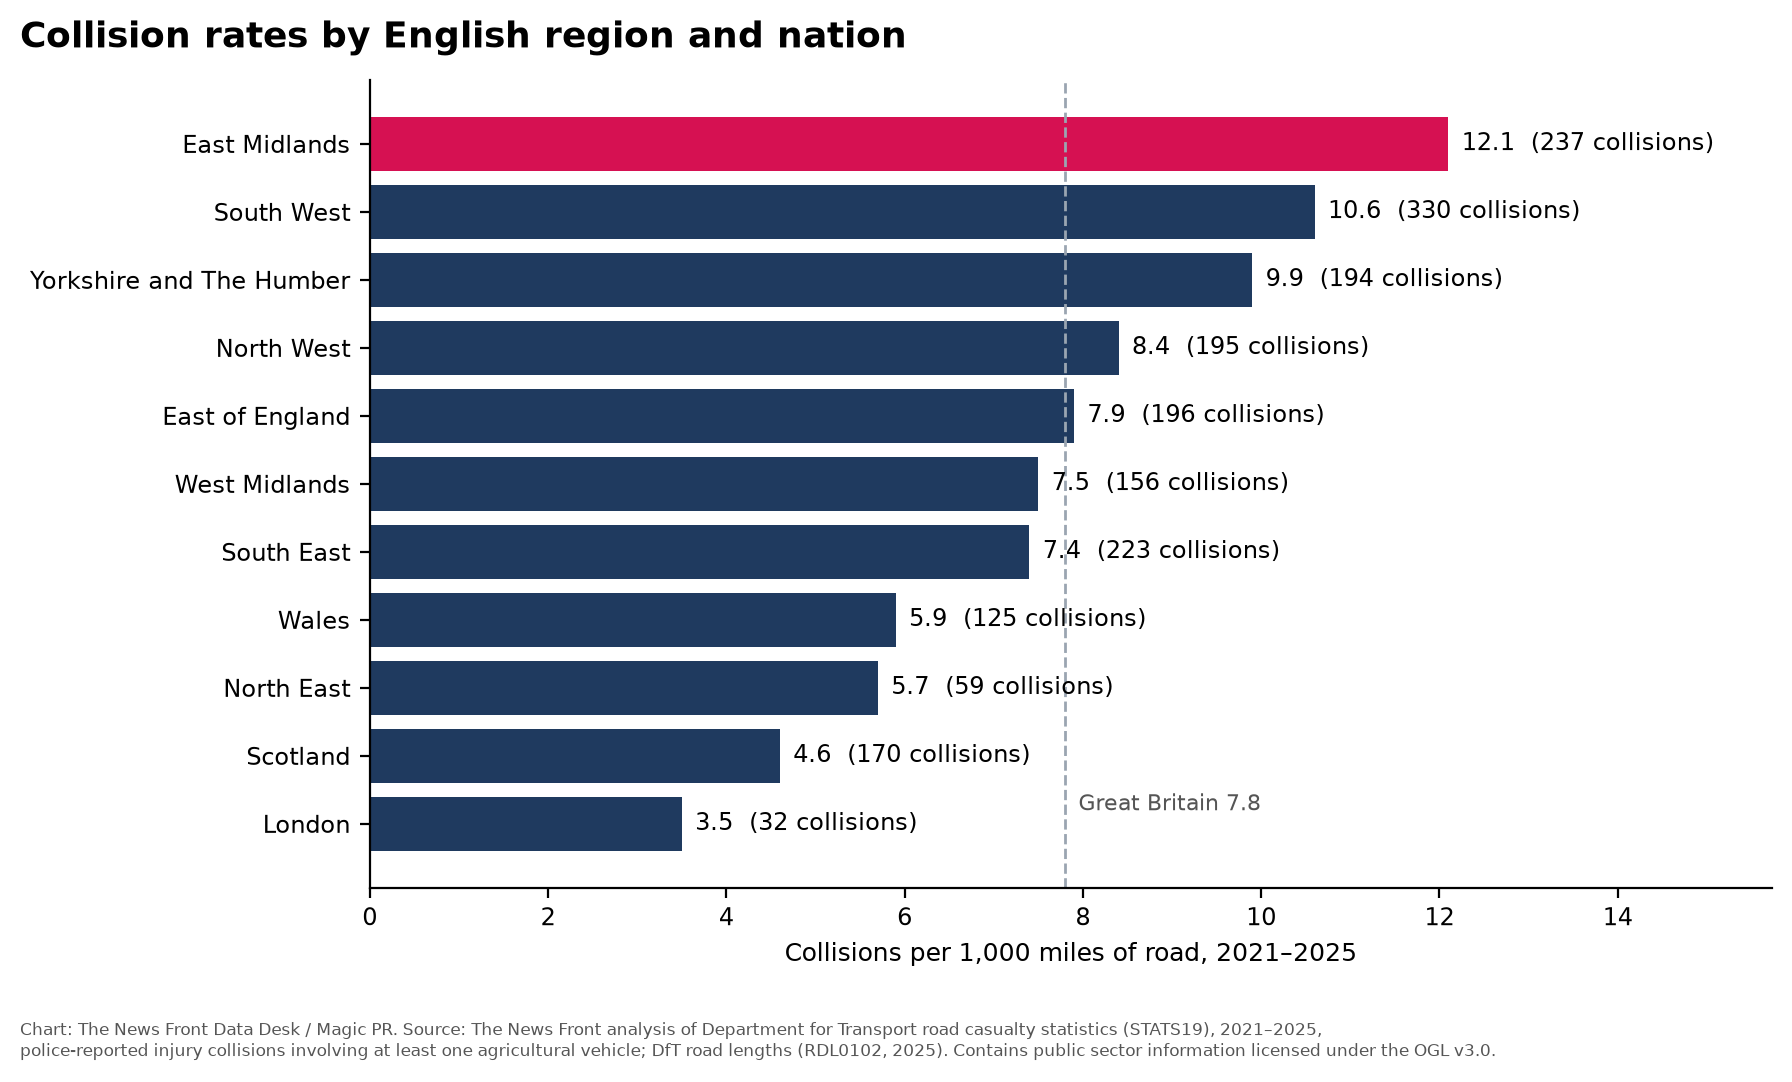
Credit: Chart: The News Front Data Desk / Magic PR
What this chart shows: collisions per 1,000 miles of road in each English region and in Scotland and Wales, 2021 to 2025.
What does official road safety guidance say?
This analysis does not show what caused any collision, and it does not assign fault to farmers, drivers or anyone else. Official guidance covers several of the conditions the figures describe:
- Lights and visibility: under Rule 113 of the Highway Code, vehicles must have their sidelights and rear registration plate lights lit between sunset and sunrise, and headlights should be used at night, except on roads with lit street lighting.
- Country roads, farm vehicles and mud: Rule 154 of the Highway Code asks drivers to take extra care on country roads, to be prepared for slow-moving farm vehicles or mud on the road surface, and to make sure they can stop within the distance they can see to be clear.
- Overtaking at dusk and after dark: Rule 163 of the Highway Code asks drivers to take extra care at night and in poor visibility, when it is harder to judge speed and distance. Rule 164 advises dropping back from large vehicles, including agricultural vehicles such as a tractor with a trailer, and not overtaking if in doubt.
- Slow-moving vehicles: Rule 169 asks anyone driving a large or slow-moving vehicle not to hold up a long queue of traffic, and to pull in where it is safe and let traffic pass.
- Roadworthiness and beacons: Driver and Vehicle Standards Agency guidance on tractors explains that owners must make sure a tractor is roadworthy before it is used on a public road, and that vehicles with four or more wheels and a maximum speed of less than 25mph must show an amber warning beacon on unrestricted dual carriageways.
About this research
This study was commissioned by Nick Young Tractor Parts, a supplier of new, aftermarket, remanufactured and used tractor parts based in North Owersby, Lincolnshire (organisation profile). It was produced by The News Front Data Desk at Magic PR, which owns and operates The News Front. The News Front Data Desk designed the method, ran the analysis and decided what is published.
The analysis counts police-reported injury collisions on public roads in Great Britain from 2021 to 2025 in which at least one vehicle was an agricultural vehicle, and compares council areas by the length of their road networks. Please credit “The News Front Data Desk” when using these figures. Published 3 November 2026; next update planned when the Department for Transport publishes final 2026 data.
For readers who look after farm vehicles, Nick Young Tractor Parts lists tractor lighting parts and steering and brake parts, and publishes a guide to UK towing and trailer rules for tractors.
The full council-by-council table for all 207 areas is available as a free CSV download, and every area is listed on our full data page. Read how we work in our research standards and disclosure, or browse more News Front research.
Frequently asked questions
Which council area has the most collisions involving tractors?
Lincolnshire, with 110 collisions from 2021 to 2025. It also has the highest rate for the length of its roads, 19.6 collisions per 1,000 miles of road, against 7.8 for Great Britain.
Are collisions involving tractors more likely to happen in the dark in winter?
Yes. From November to February, 32.3% of police-reported injury collisions involving an agricultural vehicle happened in darkness, compared with 7.0% from May to August. In December the share was 45.5%. Collisions overall peak from June to September, which accounted for 45.0% of the five-year total.
How many tractor accidents happen on Britain’s roads?
Police recorded 1,917 injury collisions involving at least one agricultural vehicle, such as a tractor, on roads in Great Britain from 2021 to 2025, according to The News Front Data Desk’s analysis of Department for Transport STATS19 data. 88 of these collisions were fatal.
Are collisions involving tractors more likely to be fatal?
A higher share are fatal: 4.6% of police-reported injury collisions involving an agricultural vehicle were fatal from 2021 to 2025, compared with 1.5% of all police-reported injury collisions in Great Britain.
Does the data show who caused these collisions?
No. The open data records which vehicles were involved in each collision, not who or what was at fault, so a collision involving a tractor was not necessarily caused by it.
What does the Highway Code say about tractors on country roads?
Rule 154 of the Highway Code asks drivers to take extra care on country roads and to be prepared for slow-moving farm vehicles or mud on the road surface. Rule 164 advises dropping back from large vehicles, including tractors with trailers, and not overtaking if in doubt.
Method and caveats
We used the Department for Transport’s road safety open data (STATS19) for 2021 to 2025, the latest five years of final data, published on 30 July 2026 and downloaded on 1 November 2026. We selected every collision in which at least one vehicle was recorded with vehicle type 17, “agricultural vehicle”. That gave 1,937 vehicle records in 1,917 collisions; 20 collisions involved more than one agricultural vehicle and are counted once. Casualty totals come from the casualty file and match the casualty count recorded for each collision. Each collision is placed in the current local highway authority recorded by police: county councils, unitary authorities, metropolitan districts, London boroughs and Scottish and Welsh councils, 207 areas in all. Every collision had an area, so none were removed. Rates are collisions per 1,000 miles of road, using the Department for Transport’s road lengths for 2025 (table RDL0102, published 12 February 2026). Road length is a proxy, because there is no official measure of tractor traffic by area. We considered farm holdings as an alternative but did not use them: those figures cover England only, use different areas and do not measure time on the road. Areas with fewer than 10 collisions are shown in the data but not ranked by rate; 54 areas are ranked. The data includes 95% intervals for each rate. Fatal means someone died within 30 days. Police forces record injury severity in different ways, so serious injury counts are not fully comparable between areas; the department’s adjusted national estimate is 712.3 collisions that killed or seriously injured someone, compared with 674 as recorded. Our rankings use all collisions, which are not affected.
Caveats
- The data covers injury collisions on public roads that were reported to police. It does not include incidents in farmyards, fields or private land, or collisions with no injury.
- A collision involving an agricultural vehicle is not necessarily caused by it. The open data does not record fault.
- “Agricultural vehicle” is the police category for tractors and other farm machinery, and can include some other farm vehicles.
- Many council areas have small numbers, so their rates are uncertain and year-to-year changes can be large.
- Serious injury counts depend on how each police force records severity, so area comparisons use all collisions and fatal collisions.
- Areas are current highway authorities, so recent council mergers (such as North Yorkshire, Somerset, Cumberland and Westmorland and Furness) are shown on today’s boundaries for all five years.
- Figures for 2026 are not yet final. Provisional data is due from the Department for Transport on 26 November 2026.
Contains public sector information licensed under the Open Government Licence v3.0 (Department for Transport). Our dataset and charts are released under CC BY 4.0 with credit to “The News Front Data Desk”.
Data sources
- Department for Transport, Road safety open data (STATS19): collision, vehicle and casualty files, last 5 years (2021–2025), published 30 July 2026
- Department for Transport, Road length statistics, table RDL0102 (road lengths by local authority, 2025), published 12 February 2026
- Department for Transport, Road safety open data guide 2025 and guidance on adjusted severity
Data licence: CC BY 4.0. Please credit ‘The News Front Data Desk’.
This study was funded by Nick Young Tractor Parts. The News Front Data Desk designed the method, ran the analysis and had full editorial control of the findings. Read our disclosure.